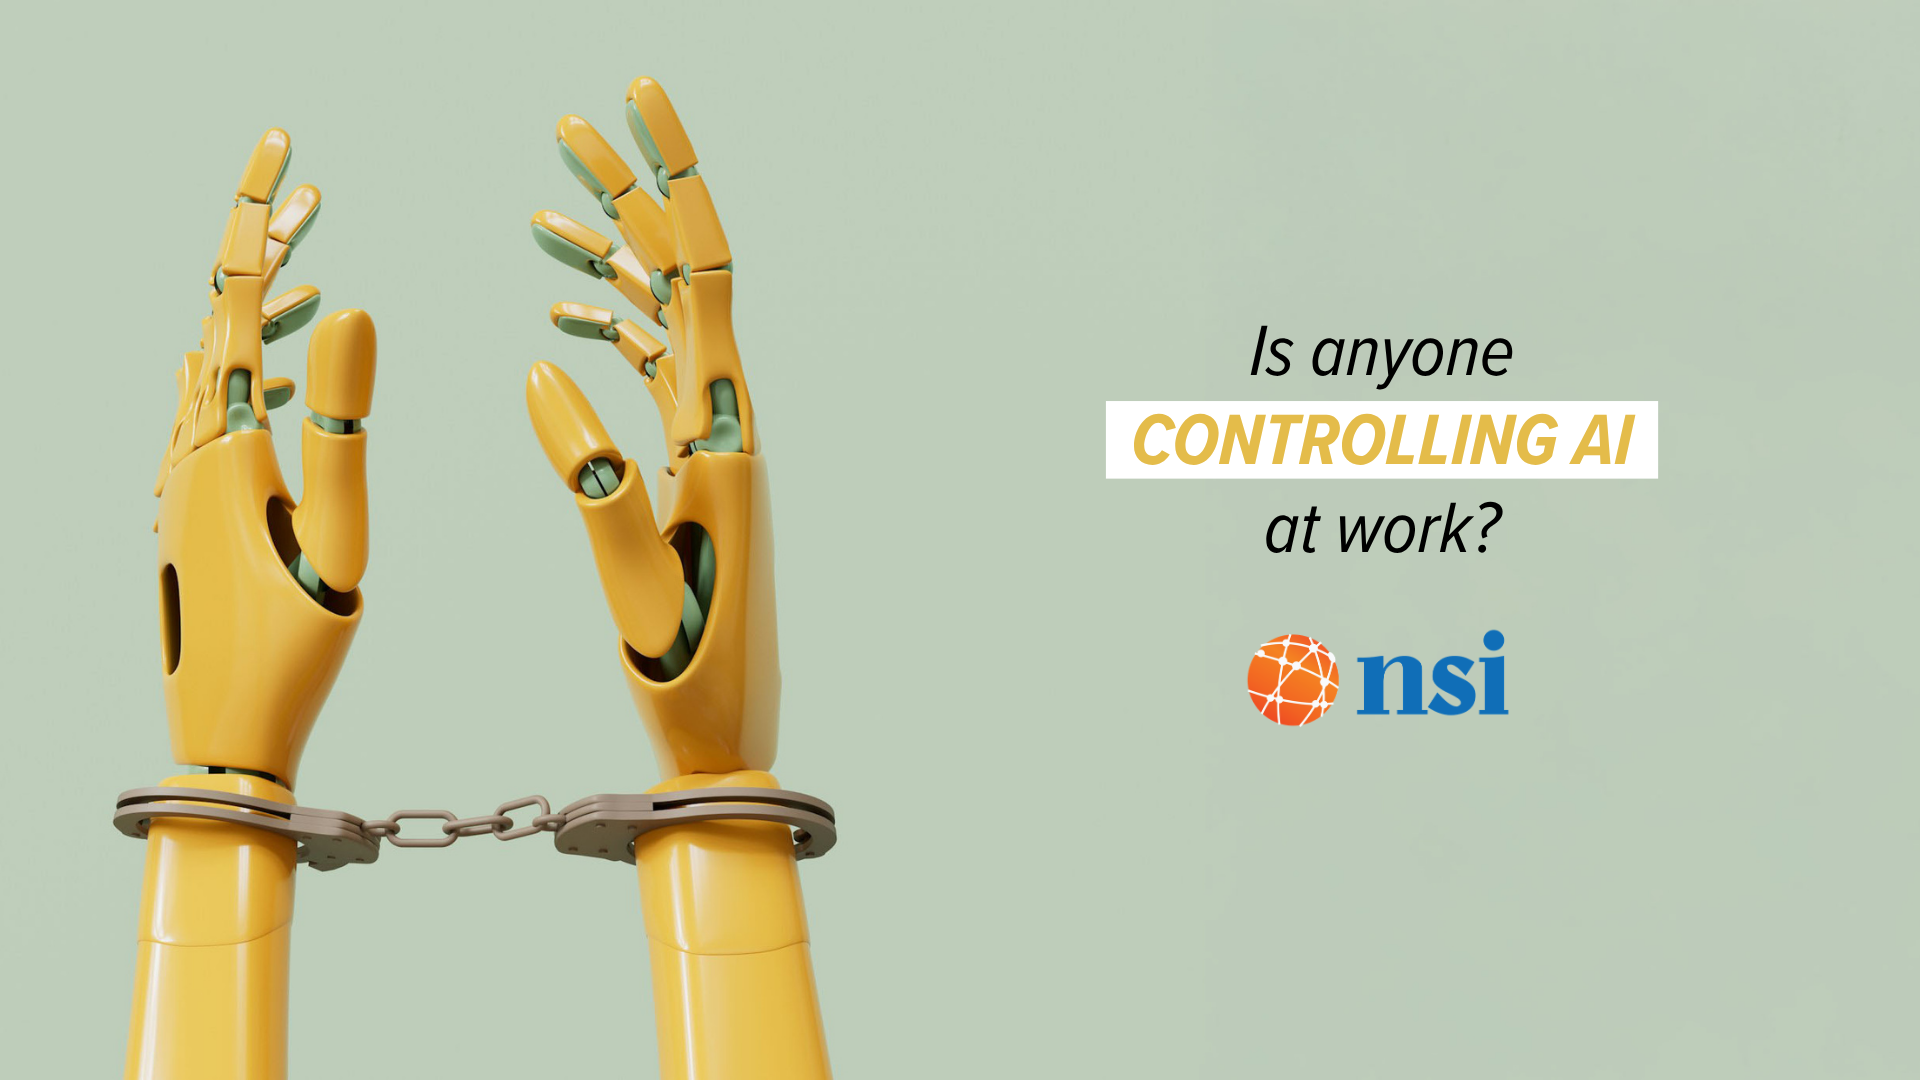
It’s time to govern your team’s AI use
Quick question: Do you know how your team is using AI at work?
Not how you think they’re using it, but how they’re really using it?
Most businesses don’t. And that’s where the risk creeps in…
Quick question: Do you know how your team is using AI at work?
Not how you think they’re using it, but how they’re really using it?
Most businesses don’t. And that’s where the risk creeps in…
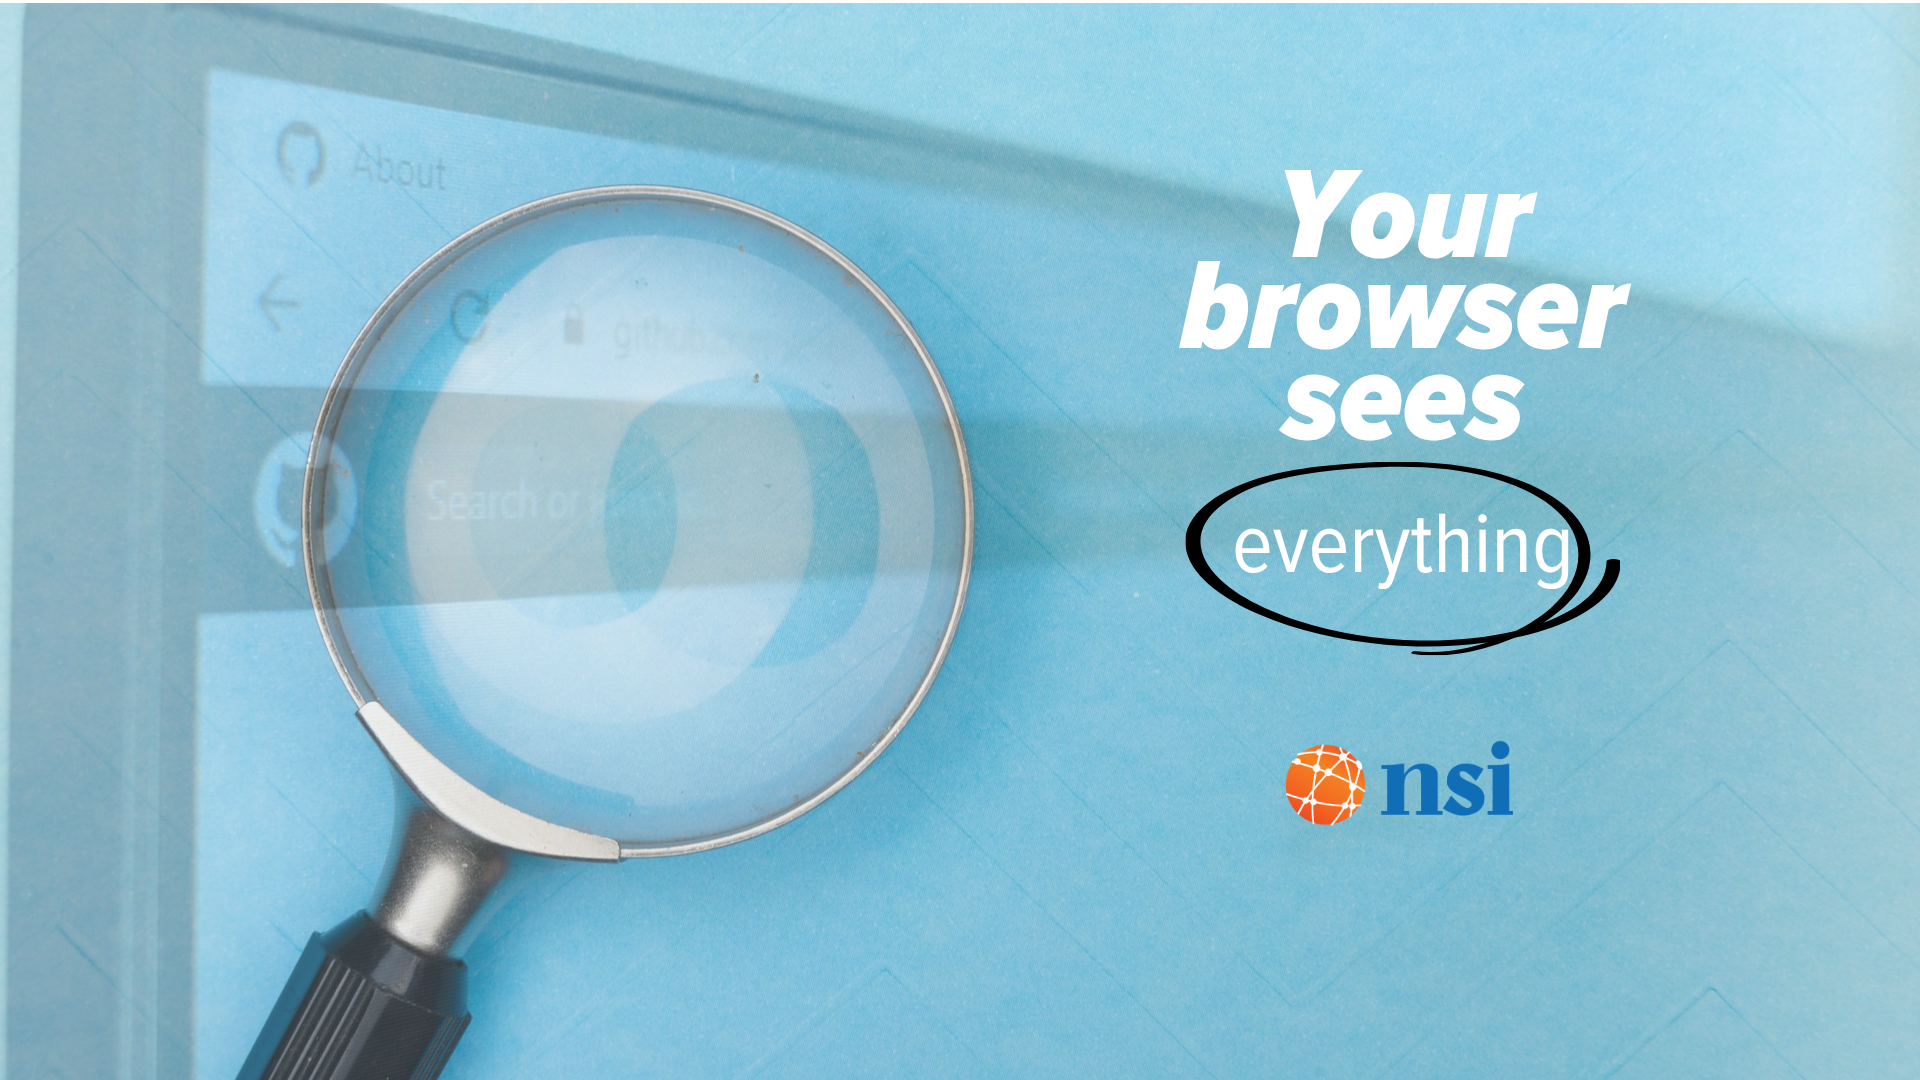
Your mobile browser knows a lot more about you than you think.
Not just the sites you visit, but patterns, habits, clues about your business.
Most people never check what’s being shared or stored behind the scenes.
It’s time you take a look…
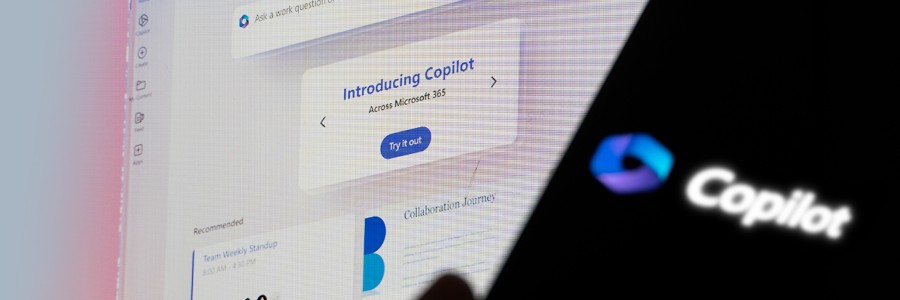
Microsoft has temporarily halted the automatic rollout of the Microsoft 365 Copilot app on Windows 11 following backlash from users and enterprise customers. The pause
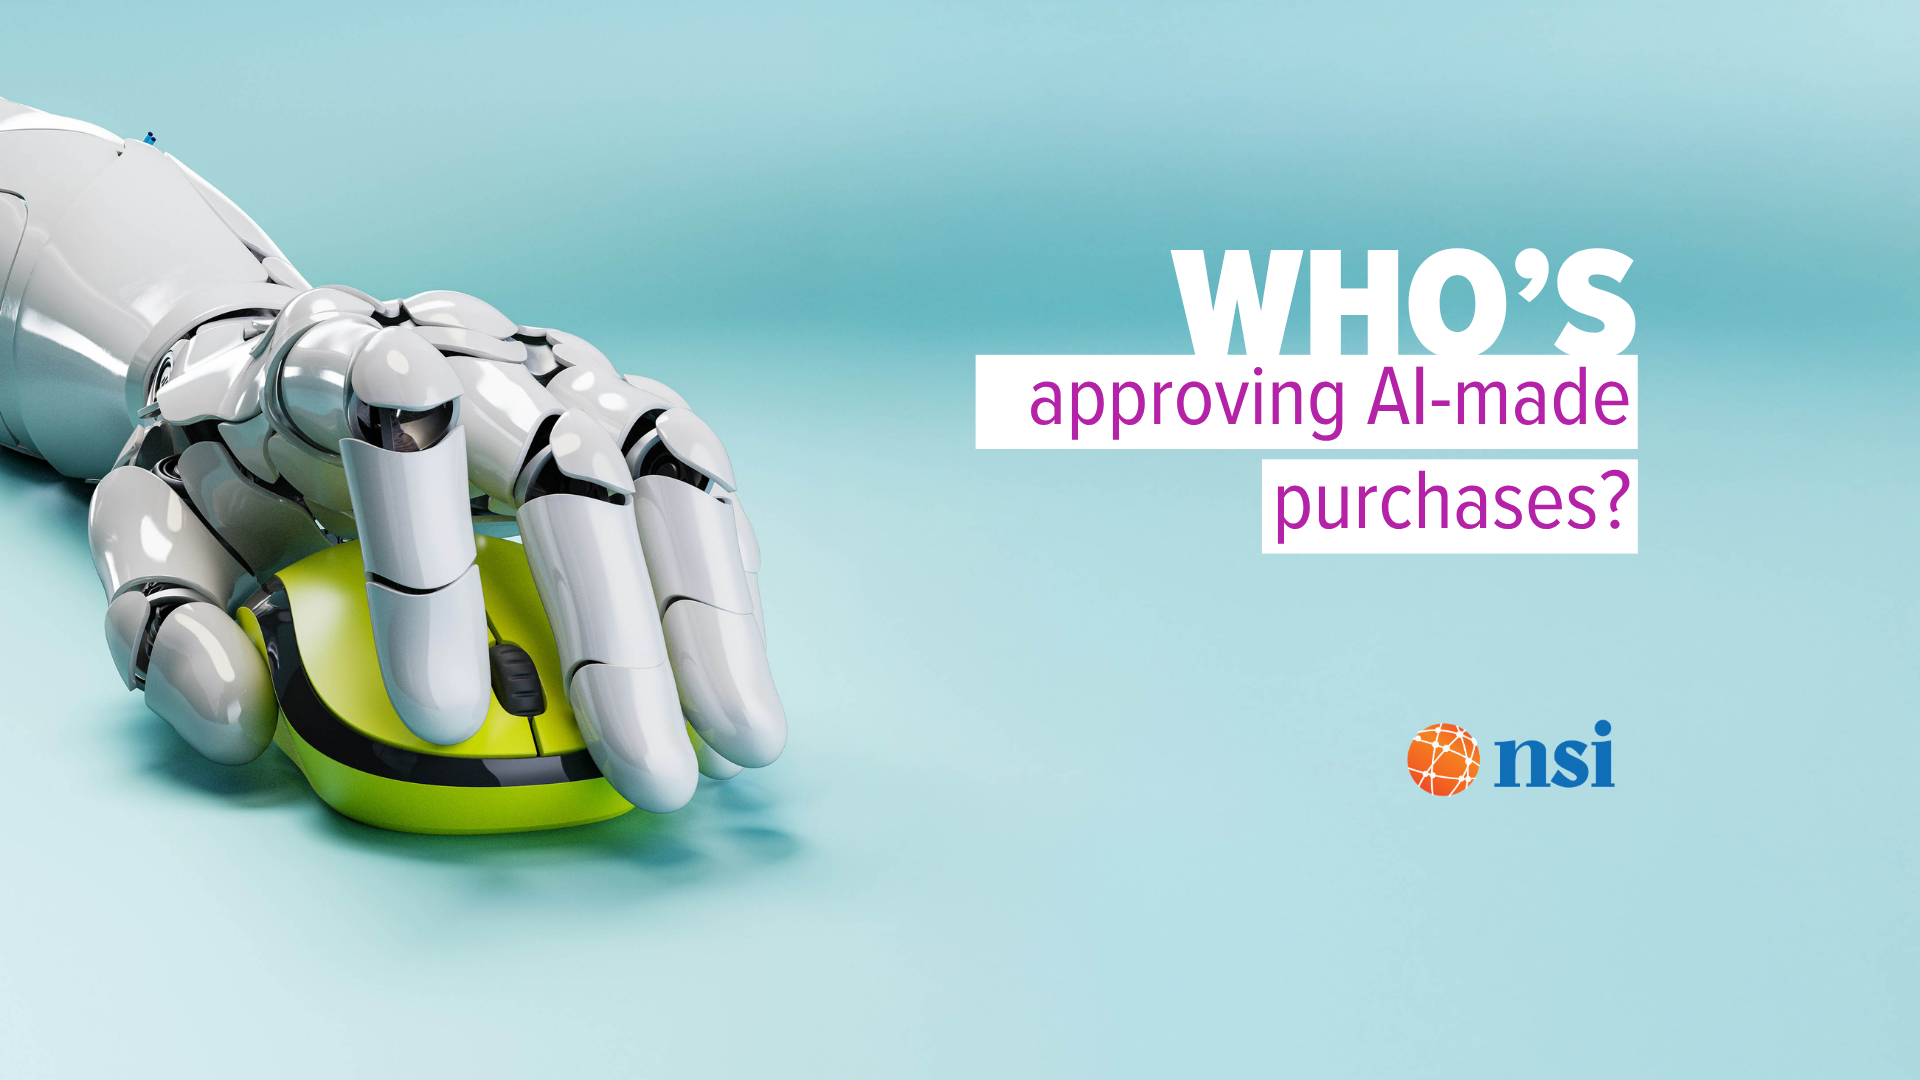
If someone on your team could buy something for work without ever visiting a website (or leaving their desk), would you know?
AI tools are changing how everyday work happens.
And now that even includes decisions that used to have checks and processes…
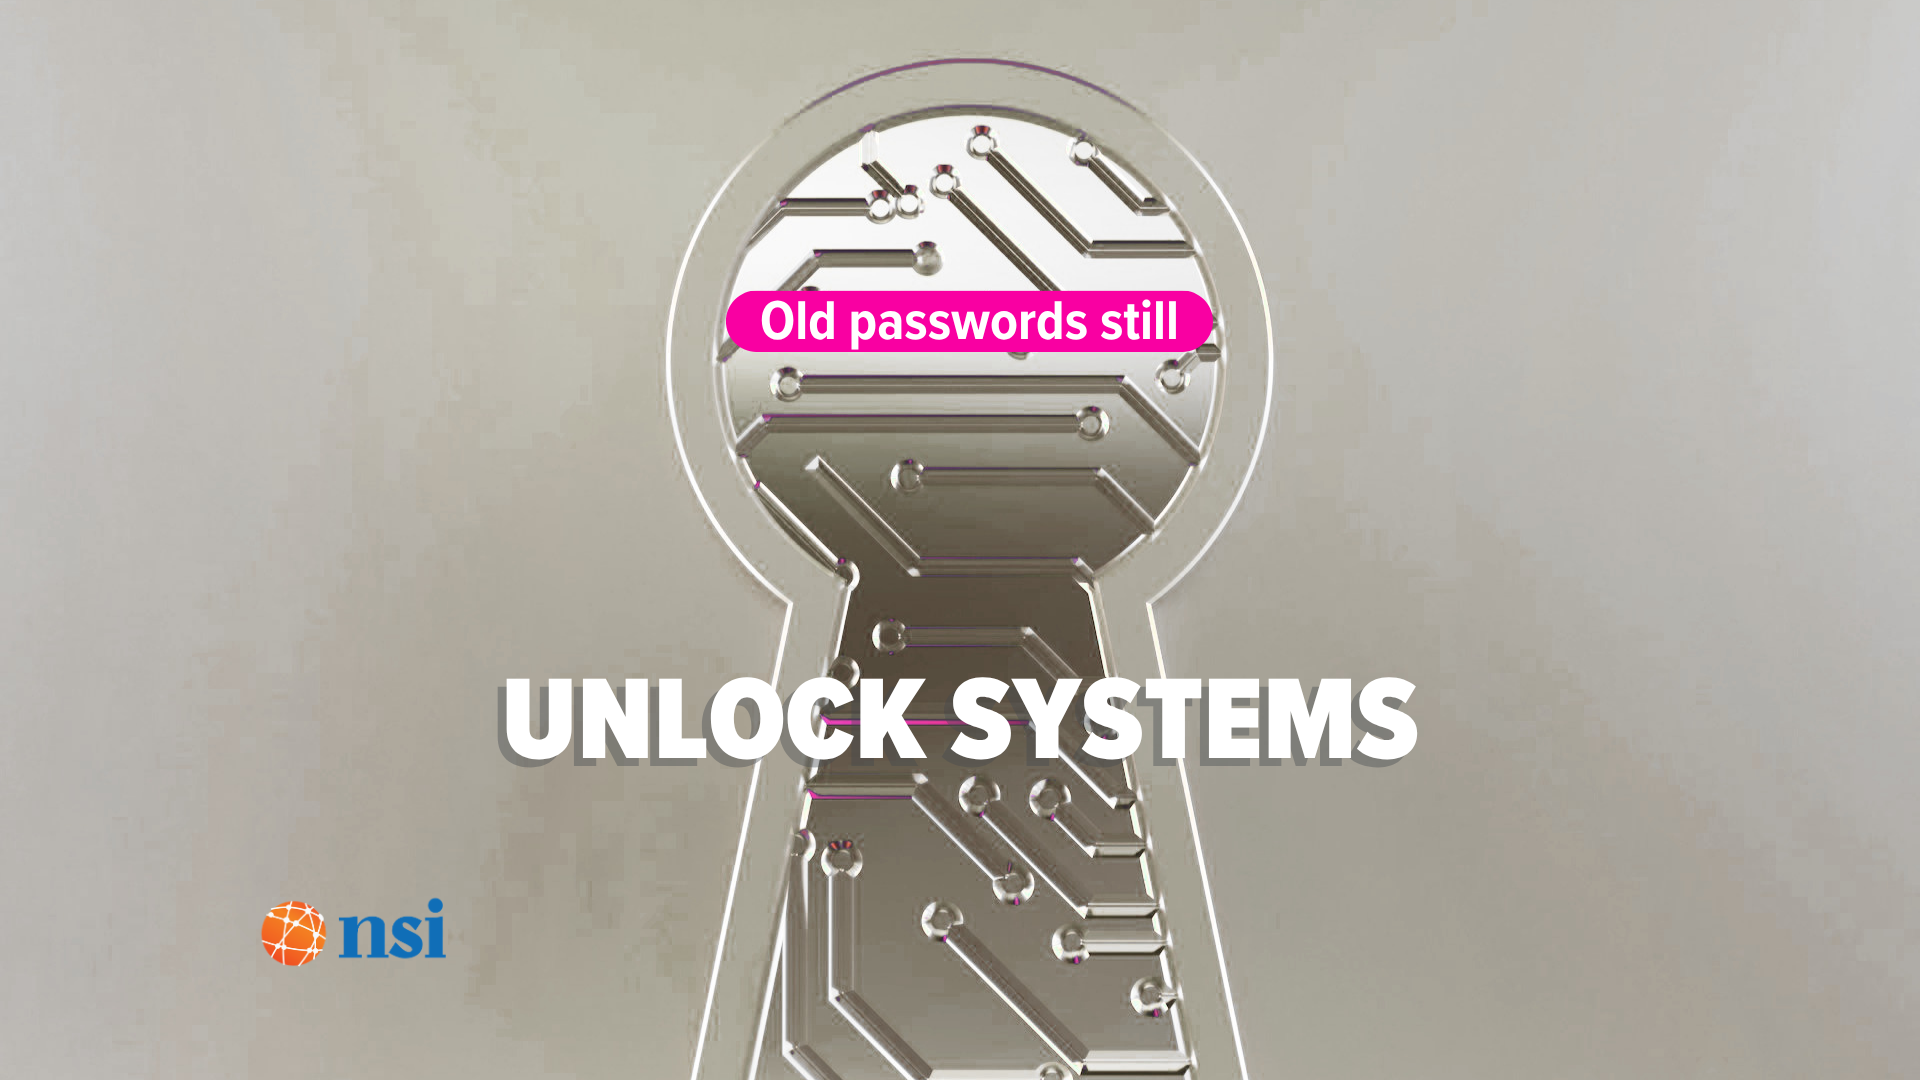
What if a password your team hasn’t used in years could still open the door to your business?
No hacking drama. No clever tricks. Just old login details quietly doing damage.
This is exactly how a recent cyber incident caught businesses out. It’s a threat many business owners don’t see coming…

Cyberthreats don’t look the way they used to.
They’re quieter now. Smarter. Harder to spot until it’s too late.
If you think today’s attackers are still using old school tactics, you might be missing the real danger already moving in the background…

It can be frustrating to work on a sluggish computer, especially when your tasks require speed and high performance. Fortunately, there’s a simple way to

Is your business feeling a little slowed down lately?
You might not need more staff, more tools, or more hours in the day.
You might be bumping into a build-up of old tech that’s quietly holding everything back…
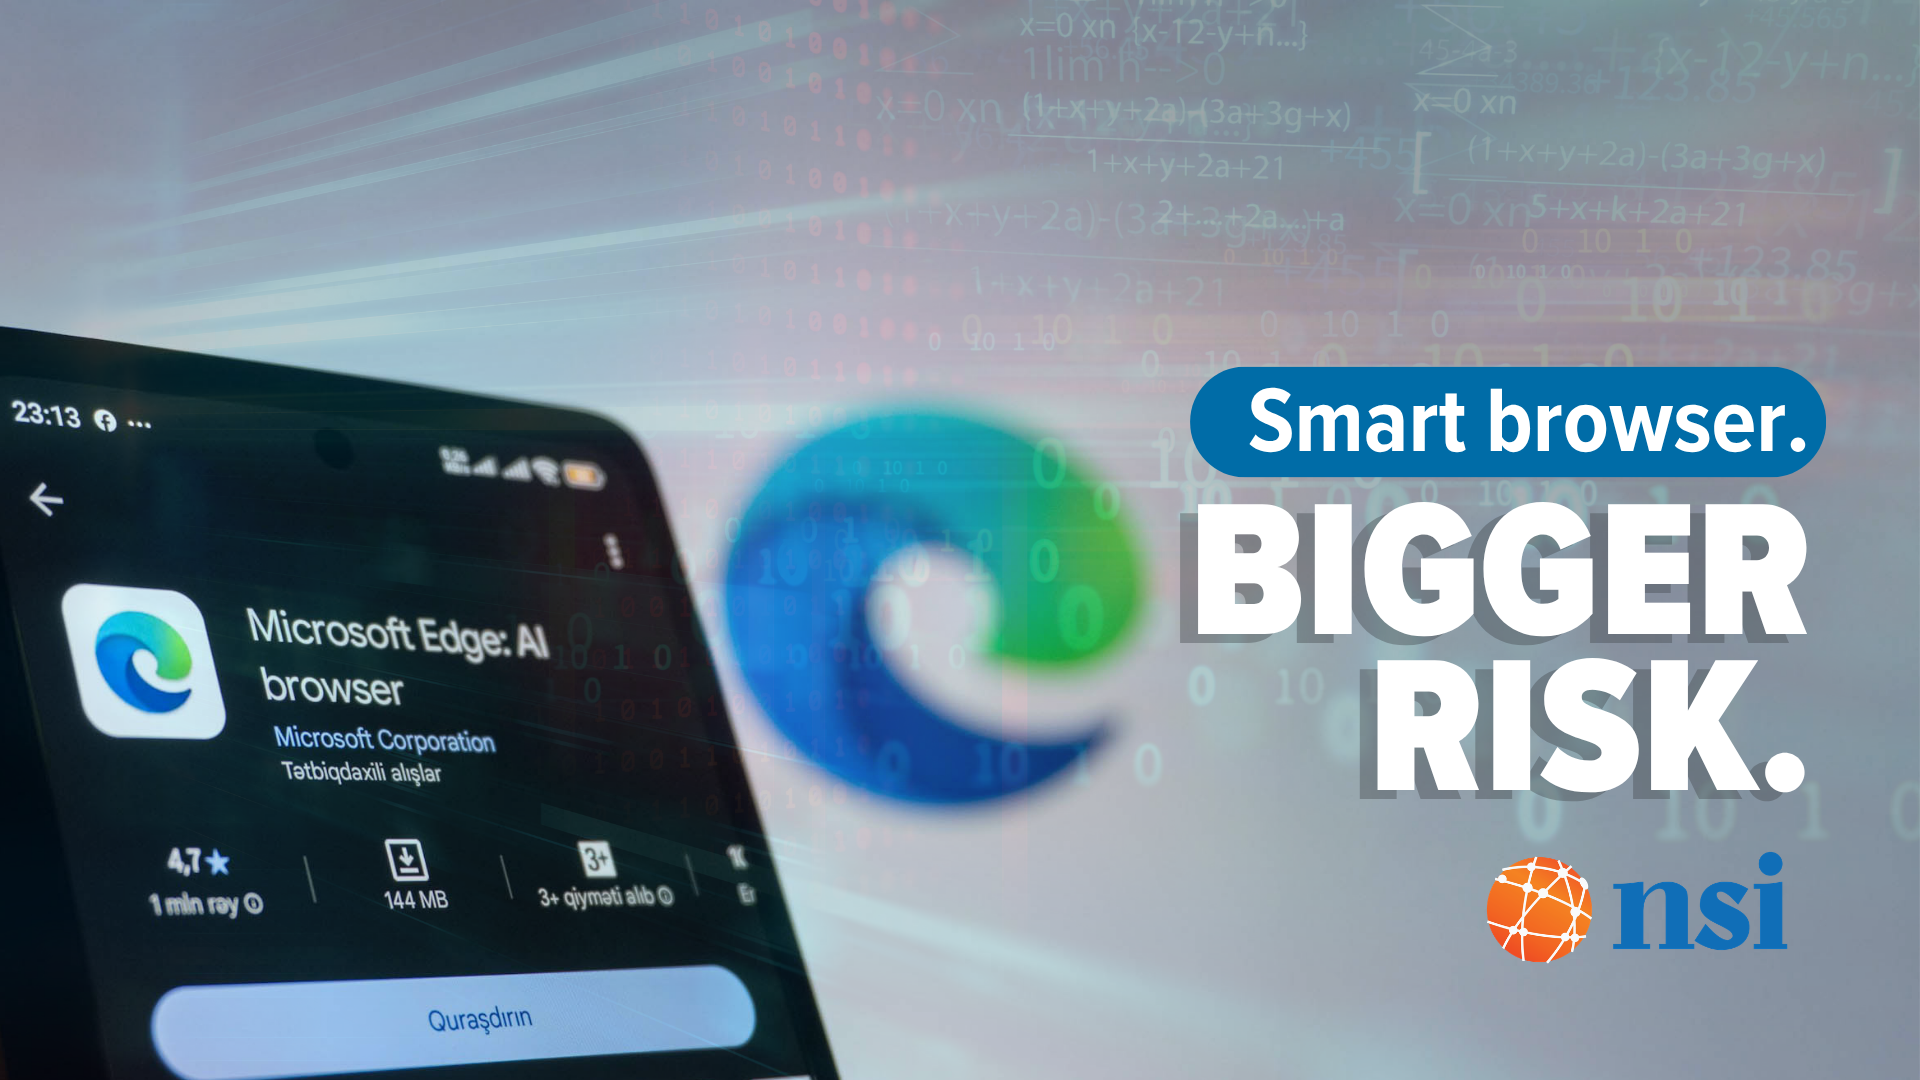
Ever wondered what really happens behind the scenes when your team uses an AI-powered browser?
There’s a hidden trade-off between convenience and security that most businesses don’t spot until it’s too late.
And it could affect your sensitive data, your compliance, and even your day-to-day operations…
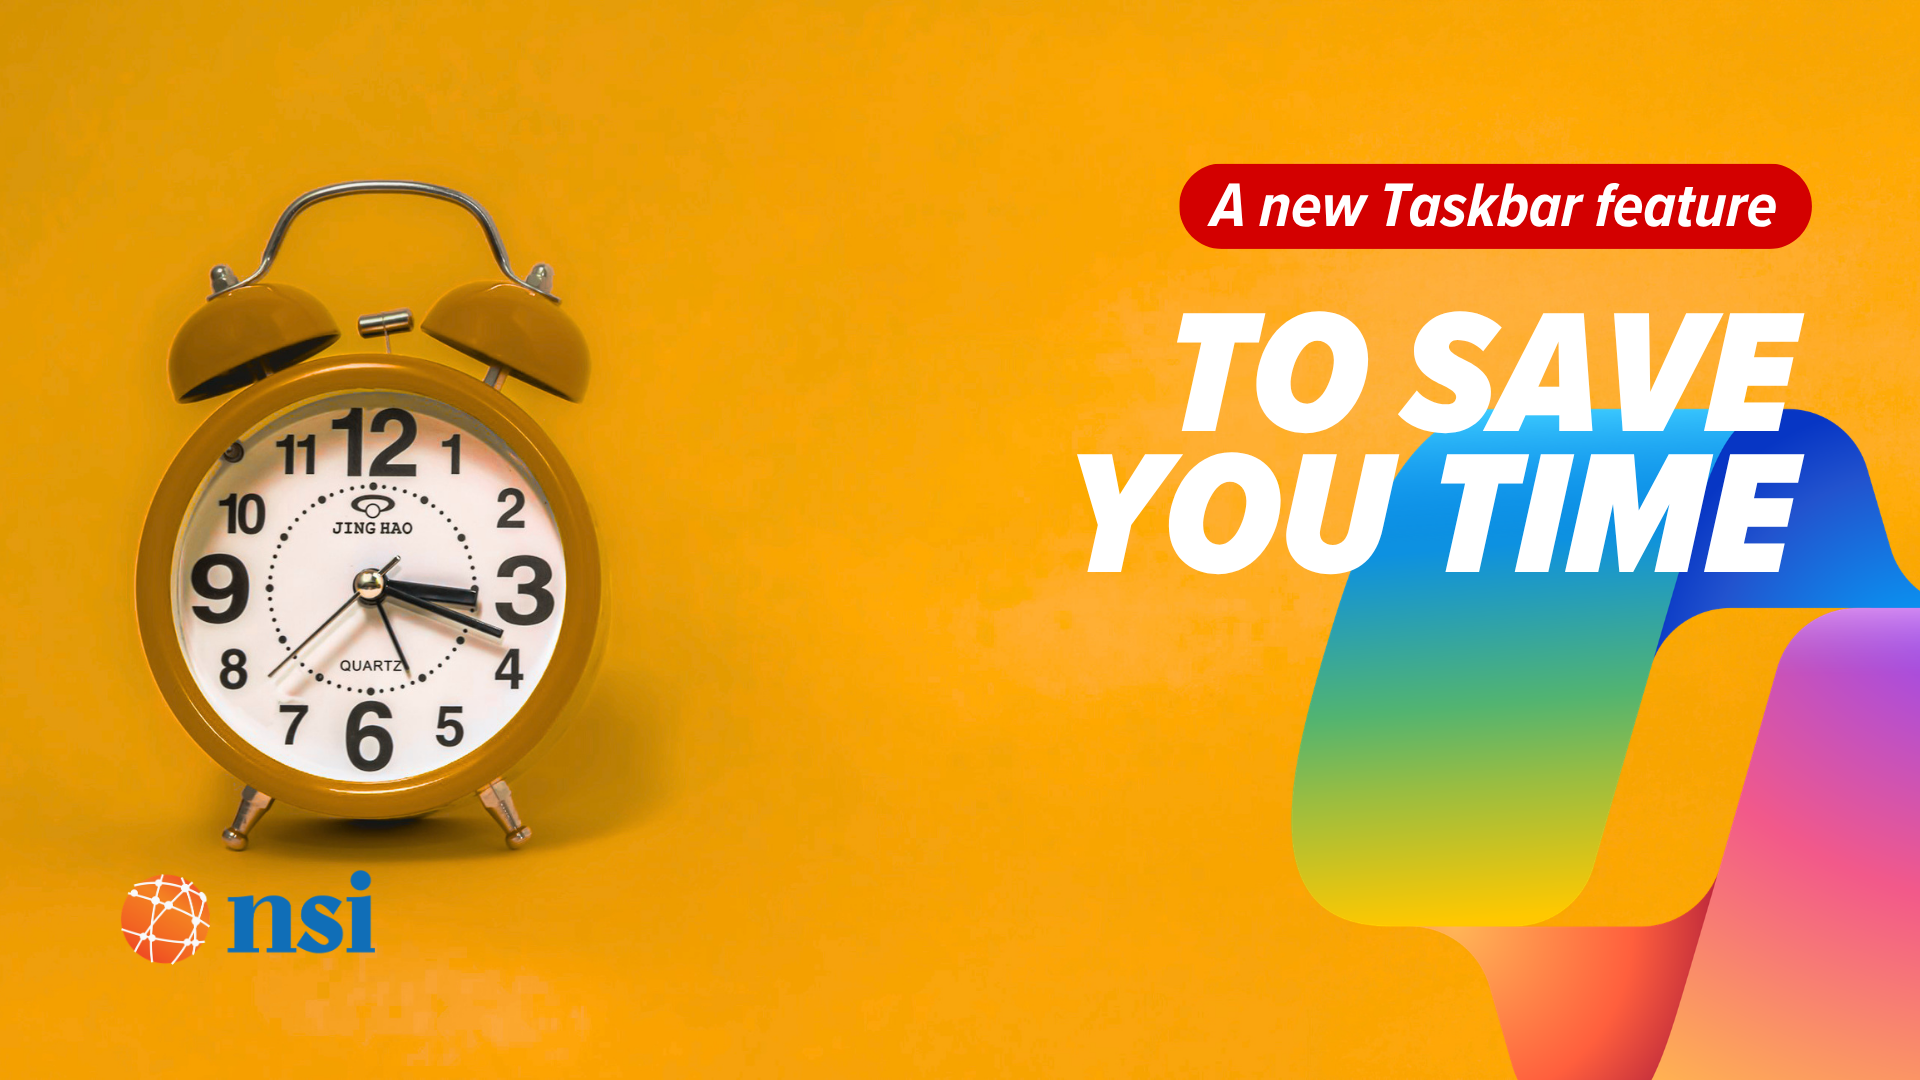
What if your computer could understand what you mean, not just what you type?
Microsoft’s testing something new in Windows 11 that could completely change how you search, click, and get things done.
It’s smart. It’s optional. And it might save your team a lot of time…